Weekend data wrangle - GRACE-Based drought indicator maps
/ Sean Turner
Scientists at NASA’s Goddard Space Flight Center generate groundwater and soil moisture drought indicators each week. They are based on terrestrial water storage observations derived from GRACE-FO satellite data and integrated with other observations, using a sophisticated numerical model of land surface water and energy processes.
That’s from the new portal for NASA GRACE data, a collaboration between NASA and National Drought Mitigation Center of University of Nebraska. Here’s a super-quick tutorial for accessing and plotting the maps using R.
This will require five libraries: raster, spData, tmap, dplyr, and viridis. If you don’t have those installed then get to it:
# get required packages
install.packages("raster")
install.packages("spData")
install.packages("tmap")
install.packages("dplyr")
install.packages("viridis")
Then you can download the .tif data straight to raster format:
library(raster)
url <- "https://nasagrace.unl.edu/data/"
date <- "20200330"
data_file <- "gws_perc_0125deg_US_20200330.tif"
raster(paste0(url, date, "/", data_file)) -> gws_raster
Let’s take a look at the raster…
gws_raster## class : RasterLayer
## dimensions : 224, 464, 103936 (nrow, ncol, ncell)
## resolution : 0.125, 0.125 (x, y)
## extent : -125, -67, 25, 53 (xmin, xmax, ymin, ymax)
## crs : +proj=longlat +datum=WGS84 +no_defs +ellps=WGS84 +towgs84=0,0,0
## source : https://nasagrace.unl.edu/data/20200330/gws_perc_0125deg_US_20200330.tif
## names : gws_perc_0125deg_US_20200330Pretty standard stuff. Now we can plot easily with tmap.
library(tmap)
tm_shape(gws_raster) +
  tm_raster()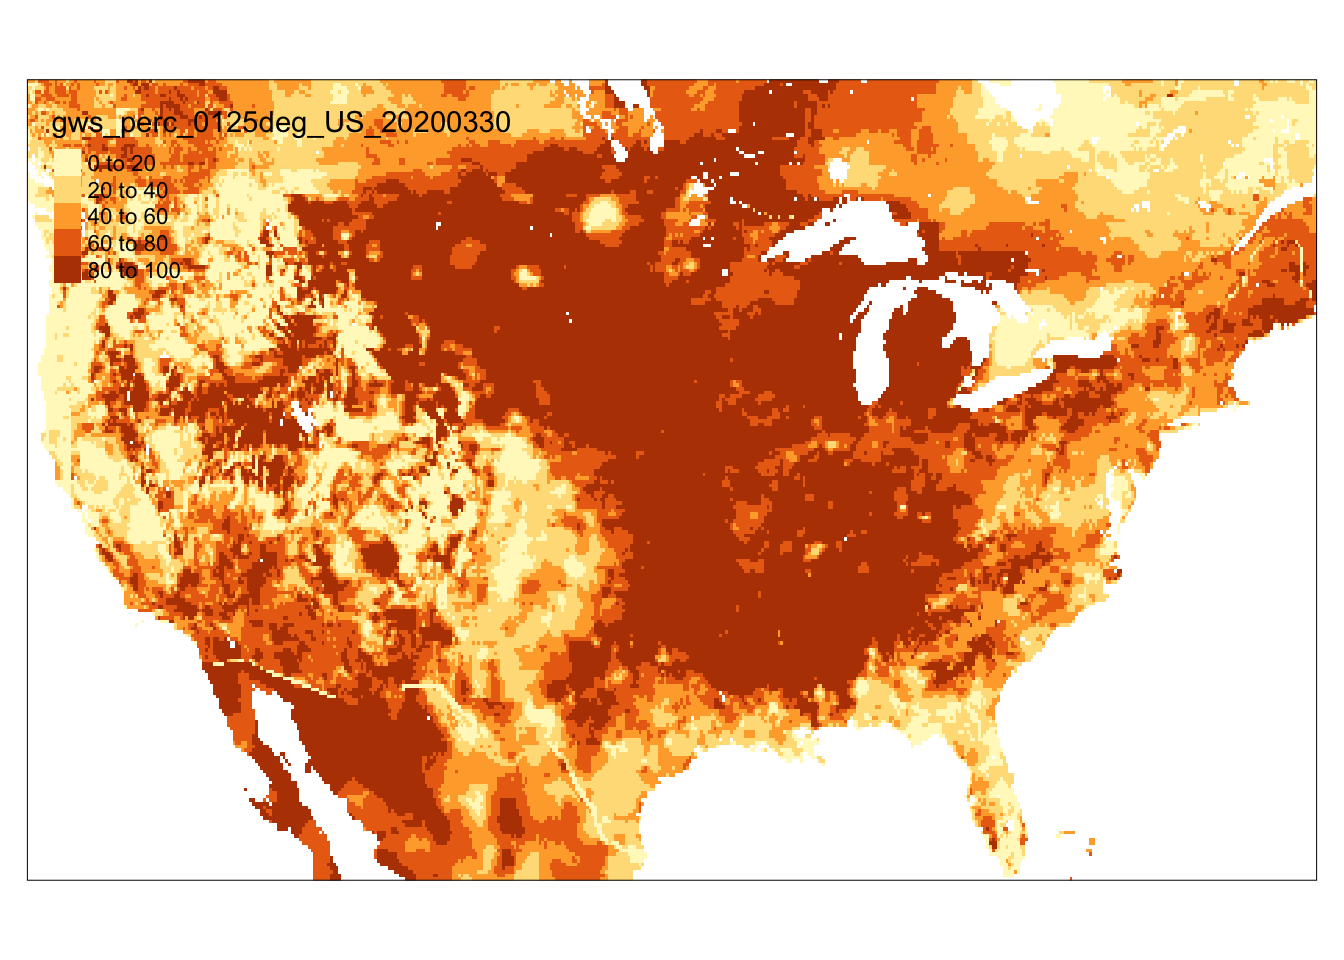
Ok that looks pretty cool. Let’s polish up with some nice US State boundaries and more impactful color scheme.
# get US state boundaries from spData
US_states <- spData::us_states
# mask raster to CONUS boundaries
gws_raster %>%
crop(US_states) %>%
mask(US_states) ->
gws_raster_masked
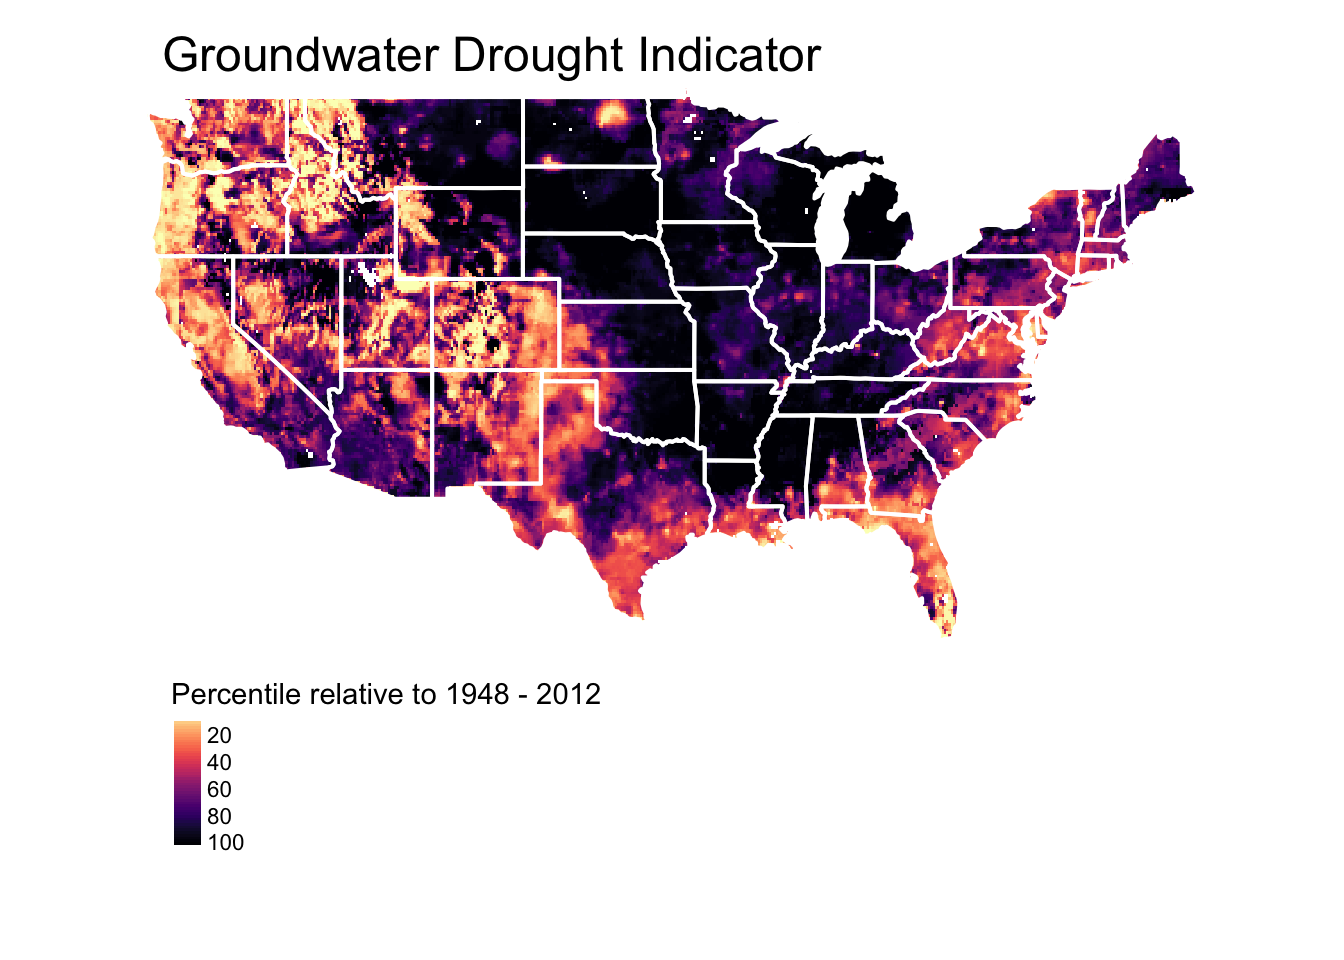
library(tmap)
tm_shape(gws_raster_masked) +
tm_raster(style = "cont",
palette = viridis::magma(256, direction = -1),
title = "Percentile relative to 1948 - 2012") +
tm_shape(spData::us_states, is.master = TRUE) +
tm_borders(col = "white", lwd = 2) +
tm_layout(legend.outside = TRUE, frame = FALSE,
legend.outside.position = "bottom",
main.title = "Groundwater Drought Indicator")