Glacier data wrangle
/ Sean Turner
Shout out to Jean Baptiste Bosson and colleagues for their recent paper in Earth’s Future, complete with a nice open dataset of global glacier area and volume projections.
Let’s wrangle ’em in R.
Note that I’ve downloaded two datasets for this analysis:
2. Bosson et al. Natural World Heritage Site Glacier projections
First step: load some libraries…
library(sf)      # for shape files
library(vroom)   # for .dat files
library(tmap)    # for map plotting
library(dplyr)   # for wrangling
library(purrr)   # for mapping through files
library(ggplot2) # for plotting
Next I’m loading two shape files…
# Glacier for Olympic National Park
st_read(paste0(
  "../../../Large data files/",
  "Earths_Future_2019_bosson_al_data/",
  "RGI6.0 shapefiles of Glaciers in Natural World Heritage Sites in 2018/",
  "19_Olympic_National_Park.shp"
  ), quiet = TRUE) -> glacier_shape

# Shapefile for National Park boundaries
st_read(paste0(
  "../../../Large data files/",
  "NPS_-_Land_Resources_Division_Boundary_and_Tract_Data_Service/",
  "622305c9-fb01-40e6-97ac-f68aca551c38202034-1-xpq6gt.ugbbb.shp"
  ), quiet = TRUE) %>%
  subset(PARKNAME == "Olympic") ->
  Olympic_np

# test for same coordinate reference system?
st_crs(glacier_shape) == st_crs(Olympic_np)
## [1] TRUE# plot
tm_shape(Olympic_np) +
tm_polygons(col = "lightgrey") +
tm_shape(glacier_shape) +
tm_polygons(col = "blue",
border.col = NULL) +
tm_layout(frame = FALSE,
title = "Olympic National Park Glaciers")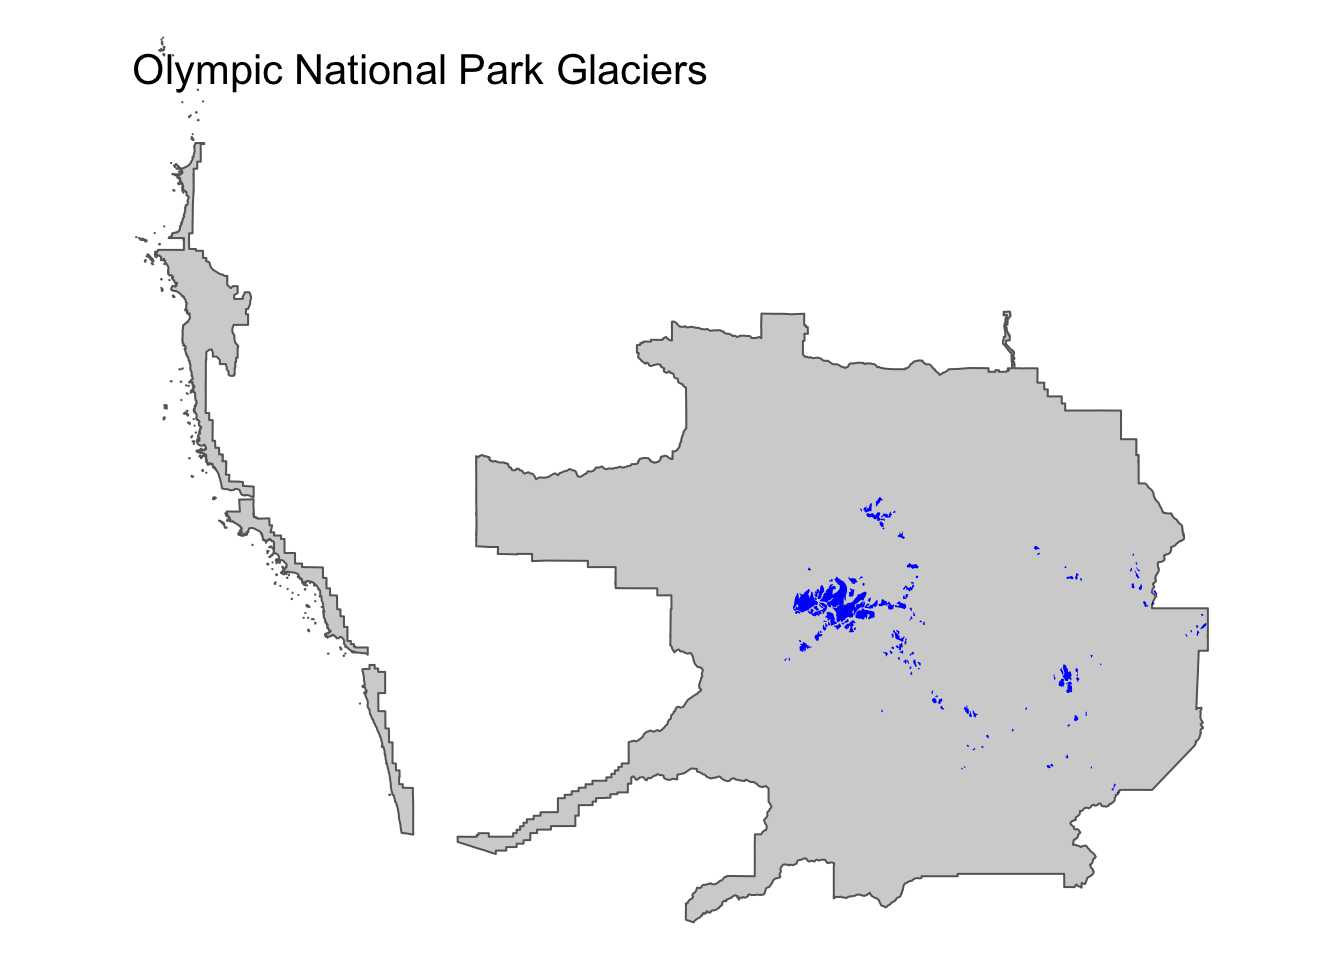
So we can see some limited glaciation in Olympic National Park.
What’s going to happen to those glaciers this century?
Now for the Bosson et al. simulations…
# get file location
paste0(
  "../../../Large data files/",
  "Earths_Future_2019_bosson_al_data/",
  "Glacier Modelling by World Heritage Site/",
  "Olympic_National_Park/19_total_Volume_"
  ) -> file_loc

# map through available rcps
c("rcp26", "rcp45", "rcp85") %>%
  map_dfr(function(rcp){
    # this part is a little funky...
    # ... cos the header and data delims are...
    # ... inconsistent in these .dat files !
    vroom(paste0(file_loc, rcp, ".dat"),
          skip = 1, col_names = F,
          delim = "       ", col_types = cols()) %>%
      select(year = X1, mean = X2, sd = X3) %>%
      mutate(rcp = !!rcp)
  }) -> glac_volume_series

# wrangle for ribbon plot
glac_volume_series %>%
  mutate(max_ = mean + sd, min_ = mean - sd) %>%
  ggplot(aes(x = year, fill = rcp)) +
  geom_ribbon(aes(ymax = max_, ymin = min_),
              alpha = 0.5) +
  theme_classic() +
  labs(title = "Volume of glaciers in Olympic National Park (cubic km)",
       x = NULL)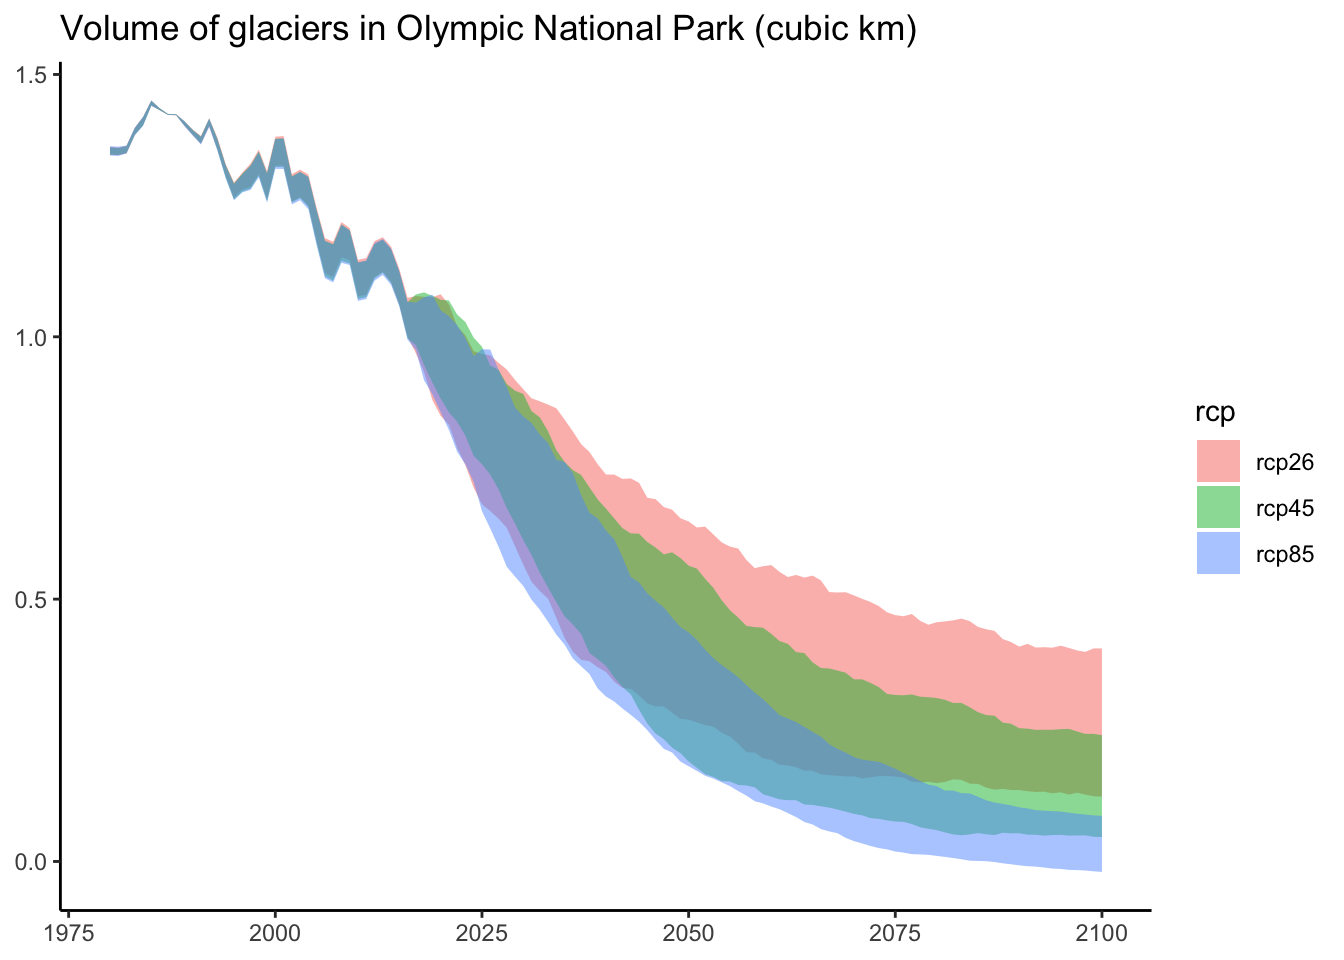
Bye bye Olympic National Park glaciers :(
May the 4th be with you.
Citation: Bosson, JB, Huss, M & Osipova E (2019). Dataset of the paper Disappearing World Heritage glaciers as a keystone of nature conservation in a changing system, Earth’s Future.